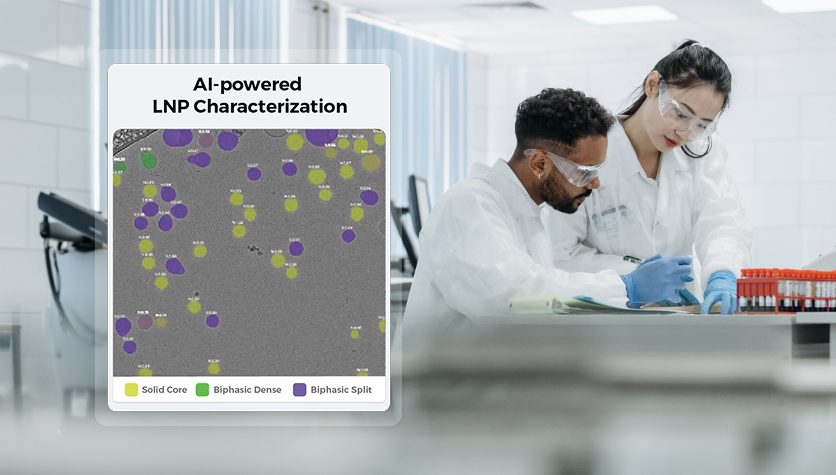
Should you trust AI-Powered Cryo-EM for your LNP structure characterization?

ATEM Structural Discovery
3 min read
lpn characterization

Should you trust AI-Powered Cryo-EM for your LNP structure characterization?

Summary

Lipid nanoparticle (LNP) samples can look consistent on paper while containing real particle-to-particle variation that a single population average may mask. AI-powered cryo-EM can characterize thousands of individual particles per sample. Validation of the ATEM’s platform shows a 99% confidence interval up to 1 nm for mean particle diameter and 96.3% agreement with expert morphology classification.

Dynamic light scattering (DLS) remains the default choice for sizing LNPs because it is fast and needs little sample preparation. But DLS reports a population-level average weighted toward larger particles, which can obscure smaller subpopulations [1]. DLS also cannot resolve morphology or internal structure [1]. Cryo-EM allows visualization of particles individually, though manual annotation has historically limited how many particles could realistically be analyzed. ATEM’s AI-powered LNP characterization reduces that bottleneck, making it practical to analyze complete datasets in about 20 minutes.

AI-Powered Cryo-EM vs. DLS: Real-World Data

In one siRNA-LNP formulation, Crawford et al. reported a DLS intensity-weighted z-average of 120.1 nm, while a number-weighted analysis of that same DLS dataset produced a lower mean of 96.6 nm. Cryo-EM imaging also revealed smaller particle populations that DLS did not resolve [2].   Such discrepancies in measured size within the same sample highlight the challenge of detecting true size differences between samples, particularly when those differences can significantly affect function. In one mRNA-LNP system, reformulation in a high-ionic-strength citrate buffer induced mRNA-rich “bleb” structures and increased in vitro transfection potency 64-fold over a standard buffer. The effect was attributed improved mRNA integrity within those structures [3]. Resolving differences like these depends on analyzing enough particles to represent the sample.


How ATEM Tested Precision and Accuracy


Particle Count and Confidence

ATEM used random-draw analysis across a large reference dataset to test how the confidence interval on mean diameter narrowed as more particles were included. By 5,000 particles, the 99% confidence interval had narrowed to 0.92 nm, indicating very high sampling precision around the estimated mean diameter [4]. Morphology classes making up a smaller share of the population showed wider intervals, consistent with needing larger samples to characterize them precisely.

Repeatability

When the same sample was reanalyzed under the same conditions across three replicates of 5,000 particles, the standard deviation in mean diameter was 0.4 nm. The coefficient of variation was under 1%, showing that the repeated measurements differed very little relative to the average diameter. The 99% confidence interval was also under 0.6 nm [4].


Intermediate Precision

ATEM also tested intermediate precision by repeating the analysis across three operators. The standard deviation increased slightly, to 0.7 nm, while remaining within that same confidence interval [4]. The measured proportions of Solid Core and Bi-Phasic Split particles had a standard deviation of 1.4% across runs, while the less abundant Bi-Phasic Dense class had a standard deviation of 0.1% [4].

Classification Accuracy

AI and human annotations agreed on 96.3% of classifications on average. Agreement ranged from 95% for Solid Core particles to 98% for Bi-Phasic Dense particles. The study assessed classification accuracy separately from measurement precision, which was evaluated through consistency in diameter and aspect-ratio measurements across repeated runs.


Conclusion

ATEM’s validation shows that AI-powered cryo-EM can analyze thousands of LNPs while maintaining consistent size measurements and morphology classifications that closely agree with expert annotation. This gives development teams a stronger basis for comparing formulations and batches, including less common particle populations that an average measurement may conceal. 
Planning a formulation, stability, or comparability study?


Speak with our scientific experts about your needs.