See the structure behind
every LNP decision.

Developing an LNP product means rapidly selecting the best-performing formulation confirming it stays stable and potent, replicating it through scale-up, and holding batch-to-batch quality in production.

Formulations indistinguishable by DLS, NTA and encapsulation efficiency (EE) can still differ in particle structure — and whether that difference is decision-relevant for your product is the question this page is built to help you answer. It lays out what ATEM’s cryo-EM measures, how precisely, how each readout is interpreted, and the case-study data behind every claim — including where it’s strong and where it stops.

The method · what we measure

Three Structural Readouts, Directly From The Particle

Cryo-EM images individual LNPs vitrified in their native formulation buffer — no dilution, no labels, no models. Every particle is segmented and measured, then classified by a validated machine-learning model and released by a scientist.

Size & Size Distribution

Per-particle diameter and the full distribution — not an intensity-weighted average. Area and perimeter are measured directly from the pixel mask; diameter is derived from area.

Morphology Classification

Every particle assigned to its structural class — Solid Core, Biphasic Split, or Biphasic Dense (Blebbed) — giving the true population composition behind the average.

Shape Ratio

Circularity relative to a perfect sphere, computed from measured area and perimeter. Cryo-EM is the only method that resolves this directly.

Establishing analytical reliability

Precision To Base Decisions On

Reliability is established two ways: technical replicates (same sample, repeated) define the method’s own noise floor, and accuracy is benchmarked against expert human operators. The numbers below are why a shift in the data can be read as a real change, not measurement scatter.

Classification Accuracy
AI model result validated by an expert
Bi-Phasic Dense
98%
Bi-Phasic Split
97%
Solid Core
95%
96,3%
Classification accuracy

Benchmarked against a trained human operator, on data unseen in training. Human-like agreement on morphology class.

<1.0 nm
Replicate precision

Standard deviation on average particle diameter across 10 technical replicates (5,000 particles each). Sub-nanometer reproducibility.

2,000+
Particles for robust statistics

A random-draw study shows statistics stabilize beyond ~2,000 particles — essential for resolving less-frequent morphology classes.

 Read how we validated the method

Interpreting the readouts

What Constitutes An "Optimal" Particle. The Data Behind It.

Across an independent 21-formulation DoE and an in-vivo potency study, a consistent structural signature tracked with better function — and, just as informatively, independent Fraunhofer studies showed where that signature does not hold. Here’s the short version of each finding, how we got there, and where to read the full analysis.

Diameter

Below a threshold

Encapsulation stays high below a size threshold; above it, variance rises and EE falls.

In an independent 21-formulation DoE, encapsulation was consistently high (>90%) and low-variance for smaller particles, up to an overall-size threshold of ~55 nm (≈53 nm on the solid-core population); above it, EE variance increased and average EE decreased. The threshold is product-specific — we report the shape of the relationship, not a universal optimal diameter.

Morphology

High Solid Core %

More Solid Core, fewer blebbed particles cooccured with better function.

Between two mixing technologies with identical lipids and mRNA, the more homogeneous, Solid-Core-rich material (64% vs 31%) showed significantly higher EE. Both structure and function differed — but the link did not survive within-group validation, so this is a population-level association, not a proven within-type correlation.

Shape Ratio

Above a threshold

Near-spherical particles encapsulate better; falling shape ratio is a warning.

Healthy reference material sits above 92% circularity. In the formulation DoE, lower shape ratios were associated with worse encapsulation, and shape ratio was among the strongest synthesis-controlled structural variables.

Why you can trust it

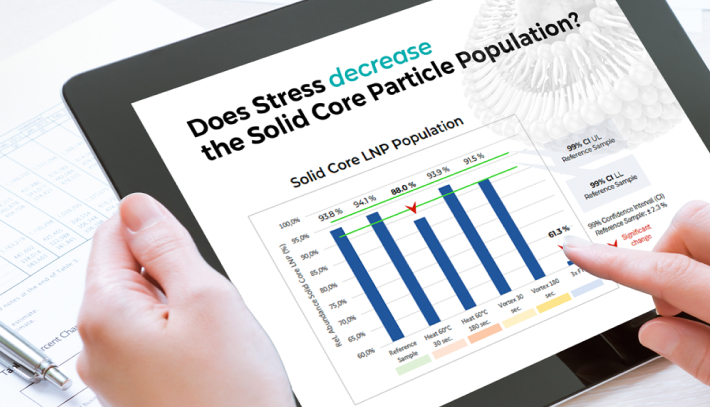
The findings rest on validated precision (96.3% classification accuracy, sub-1 nm reproducibility) and human-in-the-loop release. Stress responses are reproducible across replicates, and structural differences are read against the method’s own measured noise floor.

Our data suggests that a structure-function relationship exists. Evidence is based on a limited number of case studies, so we are continuing to investigate. We state this as our current conclusion: structure relates to function — the specific links vary from case to case – and the evidence is actively being extended. We don’t claim a specific, universal link, and whether blebbing helps or harms remains product-specific (see Stage 3).

Summarizing the structural signature, the supporting data, the interpretation rules, and how to read a morphology report.

Across the development lifecycle

Where Structure Changes a Decision. Step By Step.

Follow your program from candidate selection to commercial release. Each step shows how cryo-EM is used and what to watch; each links to an in-depth guide covering how it works, what samples to send, and the readouts that matter.

/// Placholder Lifecycle ///

Beyond the development lifecycle

Standalone Applications

Once a structural reference standard exists, cryo-EM supports several decisions outside the linear development path — each a comparison against that standard.

CDMO
Selection

Cryo-EM uniquely combines 3D structural resolution, throughput, and native-state analysis, addressing the most relevant limitations of traditional methods.

Critical-Reagent / Supplier Selection

Quantify how a change of raw-material source shifts your product’s structure against the standard.

Long-term
Stability

Track the rate of change of the morphological profile over time as a stability-indicating readout.

 Read how we validated the method

Reading the result

Four Rules For Interpreting What Changes

A number that moved isn’t a finding until it clears the method’s own noise floor. These rules sit behind every application above.

Judge Against The Noise Floor, Per Class

1

Significant if >1 nm diameter, >2% fraction, >0.2% shape ratio. Rare classes carry larger sampling error — demand a bigger effect before trusting a shift there.

Rate Of Change Is The Stability Metric

2

Stability is read as how fast structure drifts under stress, not a single snapshot. Compare rates across candidates to rank robustness.

Blebbing Is Context-Dependent

3

In stress data, rising blebbed fraction is a degradation signature. Synthesis-induced blebs may behave differently — so the good/bad call is product-specific.

Validate Within Group

4

A correlation that holds across pooled samples but vanishes within homogeneous subgroups is a process artifact, not a structure–function law. Always test the link within group before believing it.

Getting started

Sample Requirements — And We'll Handle The Shipping

A single, simple set of requirements covers most LNP studies. If cold-chain or cross-border logistics are a hurdle, ATEM can manage the shipment end-to-end so you can focus on the science.

Sample volume
≥ 50 µl
Lipid concentration
3-25 mg/ml
RNA concentration
0.0-2.0 mg/ml
Particle diameter
< 300 nm
Cryoprotectant / sugars / PEG
< 20% w/v
Nothing larger than
≤ 300 nm
Biosafety level
up to BSL 1

Requirements may vary by study type. Our scientists confirm the exact specification for your samples before you ship.

Let ATEM Manage
Your Shipment

Cold-chain handling, customs paperwork and courier coordination are often the slowest part of getting started. We take that off your plate.

Discuss how cryo-EM fits your program

We’ve outlined where structural data supports each decision across the LNP lifecycle. To discuss how it applies to your program and scope the right study, reach out to our team.